Analysis of Cancer Proteins: Pattern Identification on Escherichia coli Species
Manikandakumar K , Srikumar R , Gokul Raj K
Manikandakumar K1*, Srikumar R2, Gokul Raj K3
1Department of Physics, Bharathidasan University Constituent College, Lalgudi–621 601, Tamil Nadu, India
2Sree Lakshminaryana Institute of Medical Sciences, Villianur Commune, Kodapakkam, Pondicherry-605502, India
3Department of Computer Science, T.V.K. Govt. Arts College, Thiruvarur–610 003, Tamil Nadu, India
- *Corresponding Author:
- ManikandaKumar K
Department of Physics, Bharathidasan University Constituent College, Lalgudi–621 601, Tamil Nadu, India.
Tel: +91-431-2541100
E-mail: bioinfokm@gmail.com
Received date: October 01, 2015; Accepted date: November 23, 2015; Published date: November 30, 2015
Citation: Manikandakumar K, Srikumar R, Gokul Raj K. Analysis of Cancer Proteins: Pattern Identification on Escherichia coli Species. Colorec Cancer 2016, 1:1. doi: 10.21767/2471-9943.100005
Abstract
A major challenge of protein sequence analysis is efficient and accurate detection of pattern and similarities that allow functional prediction. We analyzed the different species of protein sequences for getting a pattern. In this work, we have analyzed to find pattern for cancer disease from Escherichia coli protein sequences. The Escherichia coli protein sequences have been compared with different species to find the pattern. This work may be used to find and design the accurate drug for cancer disease on human species.
Introduction
Human have battled against cancer throughout their existence. One of the first written descriptions of cancer is found in an Egyptian papyrus around 3000 B.C. A major challenge of protein sequence analysis is efficient and accurate detection of pattern and similarities that allow functional prediction. However, previous reports analyzed only a limited number of proteins Botos I, et al. [1] analyzed the catalytic domain of Escherichia coli in which they identified that Lon protease has a unique fold and a Ser-Lys dyad is in the active site. Eugene V et al. [2] analyzed the Sequence of similarity analysis of Escherichia coli proteins namely, Functional and evolutionary implications. Goldberg A L, et al. [3] analyzed the ATP-dependent protease La (lon) from Escherichia coli. Rasulova F S, et al. [4] analyzed the synthesis and characterisation of ATP-dependent forms of Lon-proteinase with modified N-terminal domain from Escherichia coli. Brunger AT [5] analyzed the free R value: A novel statistical quantity for assessing the accuracy of crystal structures. Botos I, et al. [6] analyzed the Atomic-resolution crystal structure of the proteolytic domain of Archaeoglobus fulgidus in which Lon reveals the conformational variability in the active sites of Lon proteases. Gottesman S and Maurizi M R [7] analyzed the regulation of proteolysis: Energydependent proteases and their targets. Engh R and Huber R [8] analyzed the accurate bond and angle parameters for X-ray protein-structure refinement. Manikandakumar K, et al. [9-15] analyzed for finding the patterns from different proteome and genome sequences. (Brunger A T, et al. [16] analyzed the crystallography and NMR system: A new software suite for macromolecular structure determination. Melnikov E, et al. [17] analyzed the coupling of proteolysis to ATP hydrolysis upon Escherichia coli Lon protease functioning of ATP hydrolysis.
Gottesman S, et al. [18] analyzed the protein quality control: Triage by chaperones and proteases. Botos I, et al. [19] analyzed the Crystal structure of the AAA+ α domain of E. coli Lon protease at 1.9 Å resolution. Brunger A T, et al. [20] analyzed the slowcooling protocols for crystallographic refinement by simulated annealing. In this work, we have analyzed to find pattern from Escherichia coli protein sequences. These sequences have been compared with different species to identify the pattern.
Results and Discussion
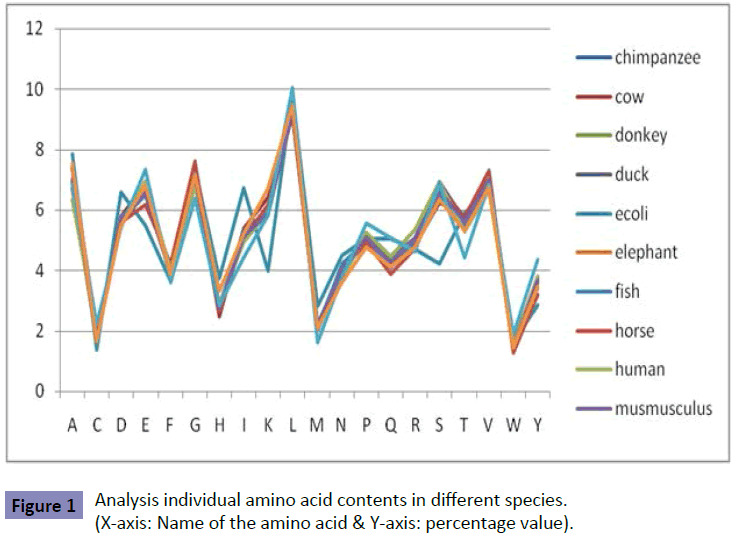
Analysis of individual amino acid contents: (Figure 1)
We analyzed the amino acids of different species for Cancer disease (Table 1). From the 12 species, it is found that the E.coli has secured the alanine at highest level (7.87%). The lowest alanine at 6.36% in human species. In cysteine amino acid, the highest score secured is 2.23 in rat species. The least score for cysteine in E.coli species is at (1.37%). The E.coli species has secured at high percentage of aspartic acid (6.59%). The least aspartic amino acid secured at (5.43%) in rat species. The rat species has secured at high percentage of glutamic amino acid (7.36%). The E.coli secured lowest glutamic amino acid (5.49%). The highest percentage of phenylalanine amino acid secured in horse species (4.23%). The lowest percentage of phenylalanine amino acid has secured in rat species (3.58%). The highest percentage of glycine amino acid is found in horse species (7.60%). The lowest percentage of glycine amino acid is found in rat species (6.37%).
| Name of the Species | Name of the Amino Acid | |||||||||||||||||||
|---|---|---|---|---|---|---|---|---|---|---|---|---|---|---|---|---|---|---|---|---|
| A | C | D | E | F | G | H | I | K | L | M | N | P | Q | R | S | T | V | W | Y | |
| chimpanzee | 6.95 | 1.82 | 5.63 | 6.5 | 3.88 | 7.07 | 2.69 | 5.11 | 5.84 | 9.26 | 2.2 | 4.07 | 5.07 | 4.41 | 5.08 | 6.55 | 5.68 | 7 | 1.5 | 3.67 |
| cow | 6.73 | 1.67 | 5.78 | 6.82 | 3.85 | 7.08 | 2.46 | 5.37 | 6.41 | 9.16 | 2.1 | 4.07 | 5.06 | 4.18 | 4.83 | 6.23 | 5.82 | 7.03 | 1.6 | 3.77 |
| donkey | 6.98 | 1.87 | 5.68 | 6.54 | 3.88 | 7.12 | 2.74 | 5.12 | 5.9 | 9.24 | 2.16 | 3.95 | 5.11 | 4.25 | 5.08 | 6.63 | 5.61 | 7.02 | 1.44 | 3.67 |
| duck | 7.01 | 1.78 | 5.66 | 6.59 | 3.88 | 7.05 | 2.69 | 5.36 | 5.96 | 9.35 | 2.25 | 4.02 | 4.9 | 4.12 | 5.08 | 6.95 | 5.68 | 6.81 | 1.41 | 3.45 |
| ecoli | 7.87 | 1.37 | 6.59 | 5.49 | 3.65 | 7.38 | 3.73 | 6.71 | 3.97 | 9.85 | 2.81 | 4.5 | 5.05 | 5.06 | 4.69 | 4.22 | 5.91 | 6.67 | 1.65 | 2.84 |
| elephant | 7.03 | 1.87 | 5.66 | 6.56 | 3.89 | 7.13 | 2.74 | 5.13 | 5.93 | 9.22 | 2.17 | 3.95 | 5.1 | 4.24 | 5.05 | 6.61 | 5.61 | 7.02 | 1.44 | 3.66 |
| fish | 7.39 | 1.71 | 5.75 | 6.47 | 4.04 | 7.18 | 2.84 | 5.32 | 5.98 | 9.22 | 2.14 | 4.22 | 4.99 | 4.09 | 4.9 | 6.41 | 5.47 | 6.9 | 1.38 | 3.61 |
| horse | 7.37 | 2.04 | 5.6 | 6.18 | 4.23 | 7.6 | 2.68 | 5.08 | 6.19 | 9.12 | 2.04 | 3.98 | 4.96 | 3.88 | 4.73 | 6.75 | 5.78 | 7.32 | 1.28 | 3.2 |
| human | 6.36 | 2 | 5.49 | 6.98 | 4.02 | 6.78 | 2.88 | 4.96 | 5.93 | 9.43 | 2.14 | 3.69 | 5.25 | 4.46 | 5.37 | 6.92 | 5.29 | 6.67 | 1.56 | 3.82 |
| musmusculus | 6.97 | 1.87 | 5.69 | 6.55 | 3.88 | 7.12 | 2.73 | 5.12 | 5.9 | 9.24 | 2.17 | 3.95 | 5.11 | 4.25 | 5.09 | 6.63 | 5.62 | 7.01 | 1.44 | 3.67 |
| rat | 6.86 | 2.23 | 5.43 | 7.36 | 3.58 | 6.37 | 2.84 | 4.41 | 5.83 | 10.06 | 1.6 | 3.78 | 5.55 | 5.06 | 4.63 | 6.9 | 4.43 | 6.86 | 1.88 | 4.34 |
| whale | 7.53 | 1.66 | 5.48 | 6.84 | 3.9 | 7.16 | 3.33 | 5.21 | 6.71 | 9.46 | 2.1 | 3.63 | 4.78 | 4.11 | 4.76 | 6.35 | 5.34 | 6.75 | 1.46 | 3.46 |
Table 1: Amino Acid calculation for different species in Cancer Disease.
The highest percentage of histidine amino acid is found in E.coli species (3.73%). The lowest percentage of histidine amino acid is identified in cow species (2.46%). The highest percentage of isoleucine amino acid is detected in E.coli species (6.71%). The lowest percentage of isoleucine amino acid is found in rat species (4.41%). The highest percentage of lysine amino acid is identified in whale species (6.71%). The lowest percentage of lysine amino acid is detected in E.coli species (3.97%). The highest percentage of leucine amino acid is found in rat species (10.06%). The lowest percentage of leucine amino acid is identified in horse species (9.12%). The highest percentage of methionine amino acid is detected in E.coli species (2.81%). The lowest percentage of methionine amino acid is found in rat species (1.6%).
The highest percentage of asparagine amino acid is identified in E.coli species (4.5%). The lowest percentage of asparagine amino acid is detected in whale species (3.63%). The highest percentage of proline amino acid is found in rat species (5.55%). The lowest percentage of proline amino acid is identified in whale species (4.78%). The highest percentage of glutamine amino acid is detected in E.coli and rat species (5.06%). The lowest percentage of glutamine amino acid is found in horse species (3.88%). The highest percentage of arginine amino acid is identified in human species (5.37%). The lowest percentage of arginine amino acid is detected in rat species (4.63%). The highest percentage of serine amino acid is found in duck species (6.95%). The lowest percentage of serine amino acid is identified in E.coli species (4.22%). The highest percentage of threonine amino acid is detected in E.coli species (5.91%). The lowest percentage of threonine amino acid is found in rat species (4.43%). The highest percentage of valine amino acid is identified in horse species (7.32%). The lowest percentage of valine amino acid is detected in E.coli and human species (6.67%). The highest percentage of tryptophan amino acid is found in rat species (1.88%). The lowest percentage of tryptophan amino acid is identified in horse species (1.28%). The highest percentage of tyrosine amino acid is detected in rat species (4.34%). The lowest percentage of tyrosine amino acid is found in E.coli species (2.84%).
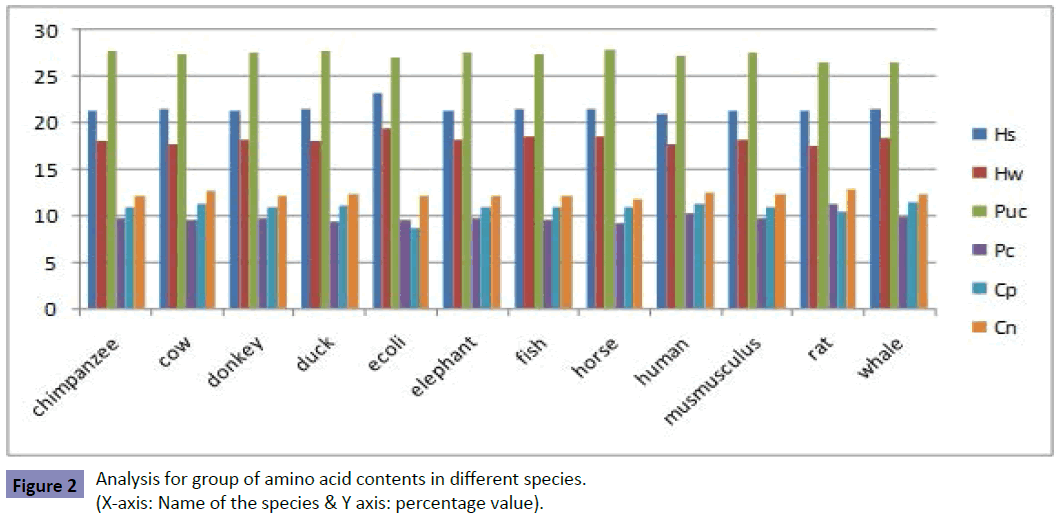
Analysis of group of amino acid contents (Figure 2 and Table 2)
| Proteins | Hs | Hw | Puc | Pc | Cp | Cn |
|---|---|---|---|---|---|---|
| chimpanzee | 21.37 | 18.1 | 27.78 | 9.68 | 10.92 | 12.13 |
| cow | 21.56 | 17.74 | 27.38 | 9.5 | 11.24 | 12.6 |
| donkey | 21.38 | 18.13 | 27.56 | 9.72 | 10.98 | 12.22 |
| duck | 21.52 | 18.04 | 27.82 | 9.33 | 11.04 | 12.25 |
| ecoli | 23.23 | 19.38 | 27.07 | 9.59 | 8.66 | 12.08 |
| elephant | 21.37 | 18.19 | 27.54 | 9.71 | 10.98 | 12.22 |
| fish | 21.44 | 18.56 | 27.37 | 9.54 | 10.88 | 12.22 |
| horse | 21.52 | 18.6 | 27.99 | 9.2 | 10.92 | 11.78 |
| human | 21.06 | 17.77 | 27.14 | 10.26 | 11.3 | 12.47 |
| musmusculus | 21.37 | 18.13 | 27.57 | 9.71 | 10.99 | 12.24 |
| rat | 21.33 | 17.59 | 26.54 | 11.29 | 10.46 | 12.79 |
| whale | 21.42 | 18.31 | 26.59 | 9.91 | 11.47 | 12.32 |
Hs–Hydrophobic strong; Hw–Hydrophobic weak; Puc–Polar uncharged; Pc–Polar charged; Cp–Charged Positive; Cn–Charged negative.
Table 2: Analysis of group of amino acid contents.
The highest percentage of hydrophobic group amino acid species is idenfied in E.coli (23.23%). The lowest percentage of hydrophobic group amino acid species is detected in human (21.06%). The highest percentage of hydrophobic group amino acid species is found in E.coli (19.38%). The lowest percentage of hydrophobic group amino acid species is idenfied in rat (17.59%).
The highest percentage of polar uncharged group amino acid species is detected in horse (27.99%). The lowest percentage of polar uncharged group amino acid species is found in rat (26.54%). The highest percentage of polar charged group amino acid species is identified in rat (11.29%). The lowest percentage of polar charged group amino acid species is detected in horse (9.2%). The highest percentage of charged positive group amino acid species is found in whale (11.47%). The lowest percentage of charged positive group amino acid species is identified in E.coli (8.66%). The E.coli species only has the least score of 8.66% when compared to other species. The other species has secured score greater than 10.46%. Therefore, the E.coli has the different pattern when compared with the other species. The highest percentage of charged negative group amino acid species is identified in rat (12.79%). The lowest percentage of charged negative group amino acid species is detected in horse (11.78%).
Analysis of E.coli pattern from individual amino acid contents
The E.coli secures the alanine and aspartic amino acid at 7.87% & 6.59% respectively. The other species has secured alanine and aspartic acid amino acid less than 7.56% & 5.78% respectively. The E.coli secures the glutamic amino acid at 5.49%. The other species has secured glutamic amino acid greater than 6.18%. The E.coli other amino acid like histidine, isoleucine, serine and threonine also secures either high or low percentage score when compared with other species. Therefore, it is found that the E.coli species is identifed with the different pattern compared with the other species individual amino acid contents.
Analysis of E.coli pattern from group of amino acid contents:
The E.coli secures the highest hydrophobic strong and hydrophobic weak amino acid group at 23.23% & 19.38% respectively when compared with other species. The other species has secured highest hydrophobic strong and hydrophobic weak amino acid group at less than 21.56% & 18.56% respectively. The E.coli species also secured the least score of 8.66% when compared with other species for charged positive amino acid group. The other species has secured greater than 10.46% for charged positive amino acid group. Therefore, it is found that the E.coli species is identified with the different pattern when compared with the other species.
Conclusion
We have analyzed different species of protein sequences. We identified a pattern on Escherichia coli protein sequences when compared with 12 different species. The Escherichia coli protein sequence only is getting a different pattern on analysis of individual amino acid contents and group of amino acid contents also. These results may be used to design a new accurate drug for cancer disease on human species.
References
- Botos I, Melnikov E E, Cherry S, Tropea J E, Khalatova A G, et al.(2004b) The catalytic domain of Escherichia coli Lon protease has a unique fold and a Ser-Lys dyad in the active site. JBiolChem279: 8140–8148.
- Eugene V Koonin, Roman L Tatusov, Kenneth E Rudd(1995) Sequence similarity analysis of Escherichia coli proteins: Functional and evolutionary implications. Proc. Natl. AcadSci 92: 11921-11925.
- Goldberg A L, Moerschell R P, Chung C H, Maurizi M R(1994) ATP-dependent protease La (lon) from Escherichia coli.Methods Enzymol244: 350–375.
- Rasulova F S, Dergousova N I, Melnikov E E, Ginodman L M,Rotanova T V(1998) Synthesis and characterisation of ATP-dependent forms of Lon-proteinase with modified N-terminal domain from Escherichia coli.BioorgKhim24: 370–375.
- Brünger A T(1992)The free R value: A novel statistical quantity for assessing the accuracy of crystal structures. Nature355:472–474.
- Botos I, Melnikov E E, Cherry S, Kozlov S, Makhovskaya O V, et al.(2005) Atomic-resolution crystal structure of the proteolytic domain of Archaeoglobusfulgidus Lon reveals the conformational variability in the active sites of Lon proteases. JMolBiol351: 144–157.
- Gottesman S,Maurizi M R(1992) Regulation by proteolysis: Energy-dependent proteases and their targets. Microbiol Rev56: 592–621.
- Engh R, Huber R(1991)Accurate bond and angle parameters for X-ray protein-structure refinement. ActaCrystallogr47: 392–400.
- Manikandakumar K, MuthuKumaran S, Srikumar R(2009a)Matrix Frequency Analysis of Oryza Sativa (japonica cultivar-group) Complete Genomes.Journal of Computer Science & Systems Biology 2: 159-166.
- Manikandakumar K, Muthukumaran S, Srikumar R, Gokulraj K,SanthoshBaboo S (2009b)Analysis of Homo sapiens (Human) Chromosomes Complete Genome Using Matrix Frequency.nst Life Sciences and Bioinformatics 1: 57-66.
- Manikandakumar K, Gokulraj K,Srikumar R,MuthuKumaran S(2010a)Analysis of parity ratio of protein sequences: A new approach based on Chargaff’s rule, Romanian Journal of Biophysics 20: 183-191.
- Manikandakumar K, Gokulraj K,Srikumar R,Muthu Kumaran S(2010b)Matrix Frequency Analysis of Genome Sequences: Pattern Identification of Turfgrass Species.World Applied Sciences Journal 11: 315-320.
- Manikandakumar K, Gokul Raj K, Srikumar R,Muthukumaran S(2010c)Classification of Protein Structural Classes using Isoluecine and Lysine Amino Acids. Journal of Proteomics and Bioinformatics 3: 221-229.
- Manikandakumar K,Muthukumaran S, Srikumar R,Gokulraj K(2012a)Graphical Representation of Protein Sequences by CGR: Analysis of Pentagon and Hexagon Structures, Journal of Pharmacy Research 5: 514-518.
- Manikandakumar K,Gokul Raj K, Muthukumaran S, Srikumar R(2012b)Secondary Structural Analysis of Families of Protein Sequences using Chaos Game Representation,Journal of Computer Science & Systems Biology 5: 047-051.
- Brunger A T, Adams P D, Clore G M, DeLano W L, Gros P et al. (1998) Crystallography and NMR system: A new software suite for macromolecular structure determination. ActaCrystallogr. D BiolCrystallogr54: 905–921.
- Melnikov E E, Tsirulnikov K B,Rotanova T V(2000)Coupling of proteolysis to ATP hydrolysis upon Escherichia coli Lon protease functioning, I: Kinetic aspects of ATP hydrolysis. BioorgKhim26: 530–538.
- Gottesman S, Wickner S,Maurizi M R(1997) Protein quality control: Triage by chaperones and proteases. Genes &Dev11: 815–823.
- Botos I, Melnikov E E, Cherry S, Khalatova A G, Rasulova F S, et al. (2004a) Crystal structure of the AAA+ α domain of E. coli Lon protease at 1.9 Å resolution. J StructBiol146: 113–122.
- Brünger A T, Krukowski A, Erickson J W(1990) Slow-cooling protocols for crystallographic refinement by simulated annealing. ActaCrystallogr A46: 585–593.
Open Access Journals
- Aquaculture & Veterinary Science
- Chemistry & Chemical Sciences
- Clinical Sciences
- Engineering
- General Science
- Genetics & Molecular Biology
- Health Care & Nursing
- Immunology & Microbiology
- Materials Science
- Mathematics & Physics
- Medical Sciences
- Neurology & Psychiatry
- Oncology & Cancer Science
- Pharmaceutical Sciences


